


Features of Version 3
- Easy to use, with modern Windows interface (configurable toolbar, context menus, simple menu structure).
- Numerous user-defined options that are automatically saved for future use.
- Saveable desktop; you can save all the results, graphs and notes of the current analysis session to disk, then restore them later to resume where you left off.
- Unlimited number of variables and cases (restricted only by available Windows memory, including both RAM and hard disk swap file).
- Data matrix manipulation:
- Built in spreadsheet-like data editor; includes full multilevel undo capabilities, row and column deletion and insertion.
- Transposition of matrix.
- Transformation of data, using logarithms to base 10, e, and 2, square root, Aitchison’s logratio for percentage data, and standardization. Individual variables may be selected for transformation.
- Conversion to range through format for stratigraphic studies.
- Can assign individual cases to pre-designated groups; these are then shown on results and graphs.
- Merging of several data files into one.
- Data import and export; Lotus 1-2-3 and Symphony, Excel, Quattro, xBase, Paradox, SIMSTAT, plain text and Cornell Ecology Programs.
- Import process eased by the use of the Import Preview dialog; lets you preview the imported data and change options to ensure successful results.
- Analyses:
- Easy selection of variables and cases to include in analysis; no need to modify original data.
- Principal Components Analysis, with the following options: correlation or covariance matrix, centred or uncentred analysis, user defined number of axes to extract, including Kaiser’s and Jolliffe’s rules for average eigenvalues, user defined accuracy level.
- Principal Coordinates Analysis, performed with the following options: use any type of input similarity matrix, user defined number of axes to extract and accuracy level.
- Correspondence Analysis, with these options: Hill’s detrending by segments, choice of cyclic Jacobi or reciprocal averaging algorithm, weighting of rare or common taxa and scaling to percentages, user defined number of axes to extract and accuracy level, choice of alternative scalings for representing cases vs. variables.
- Canonical Correspondence Analysis, a technique highly popular in ecological studies for incorporating environmental variables into an ordination of species distributions.
- Twenty three different similarity and distance measures, including Euclidean, squared Euclidean, standardized Euclidean, cosine theta (or normalized Euclidean), Manhattan metric, Canberra metric, Bray Curtis, chord, squared chord, chi-square, average, and mean character difference distances; Pearson product moment correlation and Spearman rank order correlation coefficients; percent similarity, modified Morisita’s similarity and Gower’s general similarity coefficient; Sørensen’s, Jaccard’s, simple matching, Yule’s, Nei’s and Baroni-Urbani Buser's binary coefficients.
- Cluster analysis, with the following options: seven strategies (UPGMA, WPGMA, median, centroid, nearest and farthest neighbour, and minimum variance (or Ward's)), constrained clustering in which the input order is maintained (e.g. stratigraphic studies), randomized input order, integral dendrogram production. Dual clustering of both variables and cases with a sorted data matrix being produced; allows patterns to be seen in the data.
- Diversity indices, with the following options: Simpson’s, Shannon’s, or Brillouin’s indices, choice of log base, evenness and number of species also calculated.
- Graphics
- Scatterplots (2-d and 3-d) of variables in raw data.
- Box and whisker plots of raw data.
- Scatterplots (2-d and 3-d) of PCA, PCO and CA/CCA results.
- Joint plots (scatterplot of variables and cases together) for CA/CCA results.
- Euclidean biplots (scatterplot of cases with variables plotted as vectors) of PCA results.
- CCA biplots, with environmental variables as vectors or, for nominal variables, as centroids.
- Scree plots of eigenvalues from PCA, PCO and CA/CCA results.
- Points on scatterplot can be identified by clicking on point. Also can have labels applied to all points.
- When cases are assigned to groups scatterplots show different symbols for each group. Symbol and color used is user definable.
- Dendrograms of clustering results (both graphic and text-based).
- Zoom in on graphs to view specific areas more closely.
- Fully customizable; can modify fonts, titles, colours, background style, axis scaling and placement, type and colour of scatterplot symbol. All settings saved for future use.
- Save graphs as BMP or WMF files, or copy to Windows clipboard for transfer to other programs.
Designed and written by Warren Kovach
MVSP performs several types of eigenanalysis ordinations: principal components analysis (PCA), principal coordinates analysis (PCO), and correspondence/detrended correspondence analysis (CA/DCA). It also does canonical correspondence analysis (CCA), a technique highly popular in ecological studies.
It can also perform cluster analysis, using 23 different distance or similarity measures and seven clustering strategies. A dual clustering option lets you produce dendrograms of both variables and cases in one step, along with a copy of the original data matrix, sorted in the same order as the dendrograms. Constrained clustering may also be performed, so that the original input data order is maintained. Diversity indices may be calculated on ecological data; these include Simpson's, Shannon's, and Brillouin's indices.
The number of cases and variables that can be analyzed is limited only by the amount of memory available to Windows (RAM and hard disk swap file), up to a maximum of 2 billion cases and variables.
A full list of MVSP 3 features can be viewed here.
MVSP Desktop
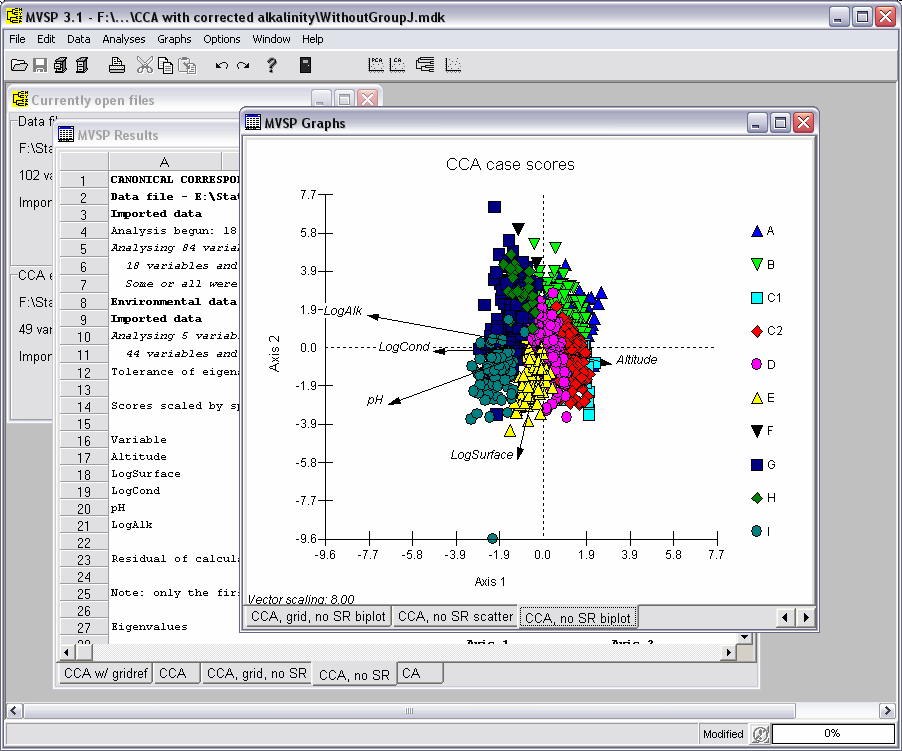
MVSP uses the KCS desktop metaphor (see this screen shot). You can spread out your data, the statistical results and graphs in front of you while you study them, just like paper on your desktop. It also has a notepad where you can jot down ideas and observations. Try new graphs, add new data, peruse the results, then print or save just those that you need. When you exit MVSP you can save the position and contents of all the windows on your desktop. Later you can restore it to the same state. MVSP lets you pick up where you left off. Multiple desktops can be saved for different projects.
Graphics
Once your data have been analyzed you can plot the results directly. Select the ordination axes you want to see and scattergrams will be drawn. Joint plots of both variables and cases can be drawn for CA results. Euclidean biplots of PCA results (with variables as vectors) can be produced, as can biplots of the environmental variables in CCA. Scree plots can also be produced for PCA, PCO and CA/CCA. Dendrograms of the cluster analysis results are drawn automatically. These graphs can be customized, with your favourite settings being saved for future use.
Scatterplots of the original variables can also be produced, as well as box and whisker plots summarizing each variable. All graphs have a zoom feature that lets you magnify parts of the graph for easier viewing.
Other Features
MVSP offers various data manipulation features, such as transformation, merging of two or more data files, and conversion to formats such as range-through. Data can be imported from and exported to a variety of formats, including Lotus 1-2-3, Excel, Quattro, xBase, Paradox, Cornell Ecology Program format and various plain text files.
Individual data cases can be assigned to groups. The group names are then printed on output and dendrograms, and the groups are depicted on scatterplots as different symbols.
A fully customizable toolbar is available. Also, the data editor and other windows have multiple level undo, letting you reverse any changes you have made in the current session.
National Chung Hsing University Department of Soil and Environmental Sciences
National Chiayi University Department of Forestry and Natural Resources
National Taiwan University School of Forestry and Resource Conservation
National Taiwan Ocean University Department of Life Science
Luodong Forestry District Office
Taiwan Agricultural Research Institute, Ministry of Agriculture